Water levels in the Western Cape’s dams increased marginally during the week of Monday, 28 July 2025. Total combined storage rose to 83.7%, up from 83.5% the previous week.
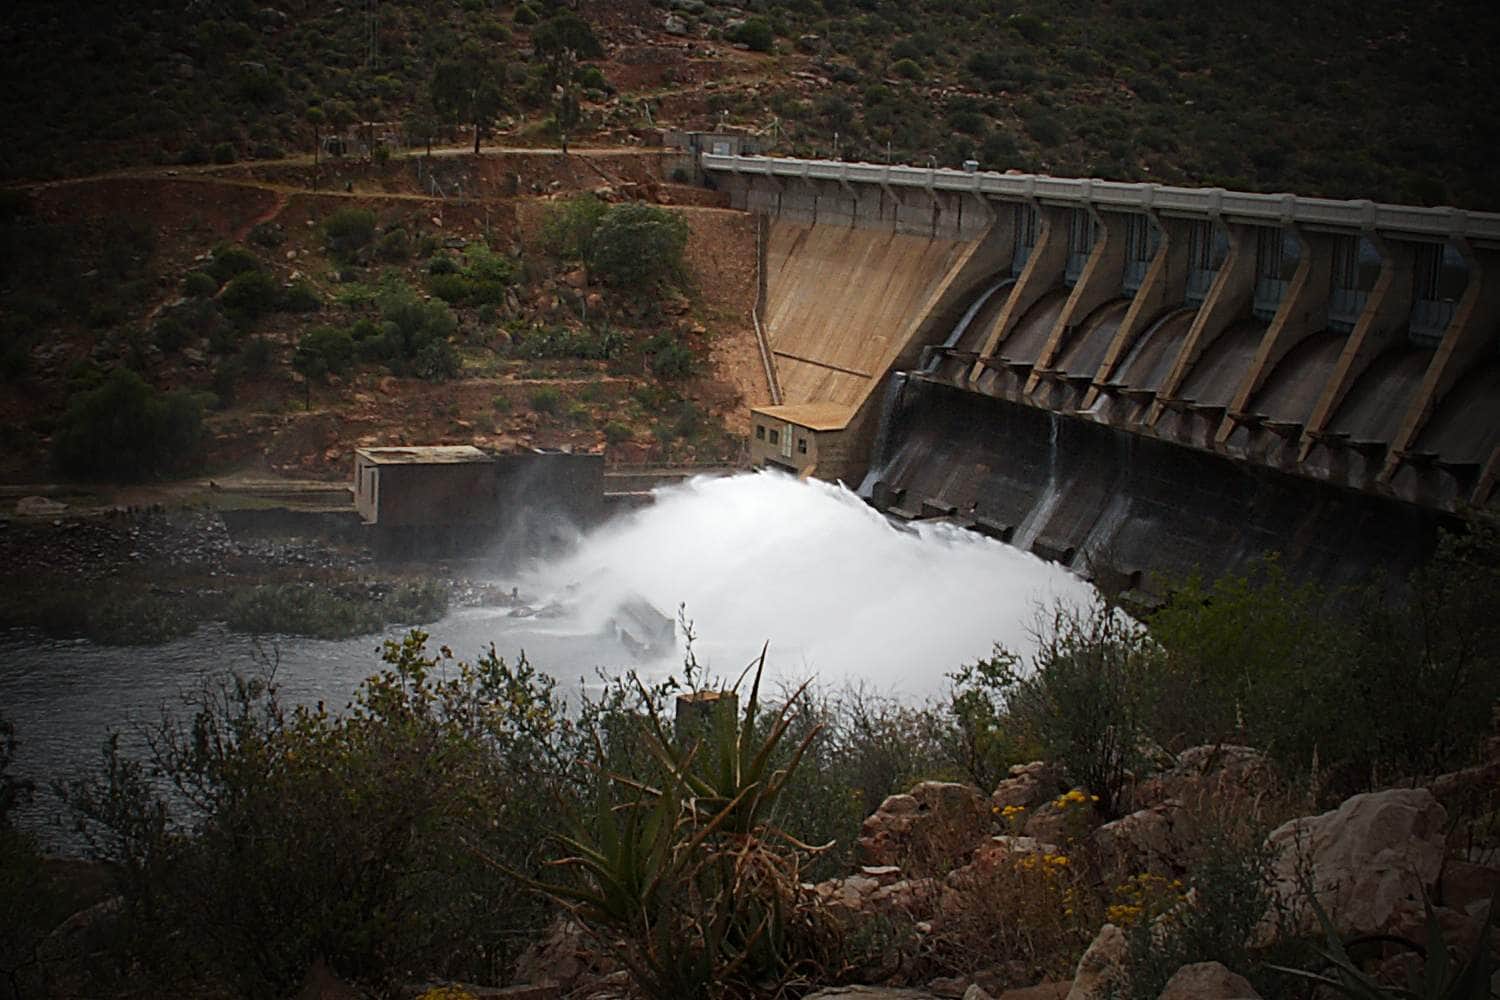
Western Cape major dam level performance on Monday, 28 July 2025
Water storage in the province’s major dams remained largely stable, with a mix of minor gains and slight decreases:
- Voëlvlei Dam saw the largest increase among the major dams, rising from 81.5% to 83.8%—a gain of 2.3 percentage points.
- Steenbras Lower Dam increased by 0.5 percentage points, now storing 76.7%.
- Berg River Dam remained close to full capacity at 100.1%, down slightly from 100.4%.
- Theewaterskloof Dam, the largest in the Western Cape, declined from 78.8% to 78.6%.
- Wemmershoek Dam fell by 1 percentage point to 83.8%.
- Steenbras Upper Dam was almost unchanged, dropping marginally from 100.0% to 99.9%.
| Dam | Capacity (ML) | Storage % on 28 July 2025 | Storage % Previous Week | % Change |
|---|---|---|---|---|
| Theewaterskloof | 480188 | 78.6 | 78.8 | -0.2 |
| Voëlvlei | 164095 | 83.8 | 81.5 | +2.3 |
| Berg River | 130010 | 100.1 | 100.4 | -0.3 |
| Wemmershoek | 58644 | 83.8 | 84.8 | -1.0 |
| Steenbras Lower | 33622 | 76.7 | 76.2 | +0.5 |
| Steenbras Upper | 31767 | 99.9 | 100.0 | -0.1 |
Rainfall analysis
Rainfall recorded in the catchment areas continues to support dam recovery. Accumulated rainfall totals since the start of the season include:
Minor dams overview
Storage trends in the minor dams reflected more variation:
- Victoria Dam rose from 35.9% to 37.2%.
- Kleinplaats Dam increased to 61.9%, up by 0.8 percentage points.
- Alexandra Dam and Hely-Hutchinson Dam both recorded slight gains of under 1 percentage point.
- Woodhead Dam dropped significantly from 84.3% to 77.8%, a decrease of 6.5 percentage points.
- Land-en-Zeezicht Dam also showed a 1-point decline to 85.4%.
- De Villiers and Lewis Gay Dams remained effectively full at 100.2% and 100.9%, respectively.
- Newlands: 289.5 mm
- Wemmershoek: 172.8 mm
- Wynberg: 186.4 mm
- Voëlvlei: 101.1 mm
- Theewaterskloof: 74.2 mm
| Dam | Capacity (ML) | Storage % on 28 July 2025 | Storage % Previous Week | % Change |
|---|---|---|---|---|
| Lewis Gay | 57 | 100.9 | 100.5 | +0.4 |
| Wynberg | 103 | 89.8 | 89.5 | +0.3 |
| Alexandra | 85 | 48.2 | 47.9 | +0.3 |
| Victoria | 27 | 37.2 | 35.9 | +1.3 |
| Woodhead | 927 | 77.8 | 84.3 | -6.5 |
| Hely-Hutchinson | 955 | 94.3 | 93.5 | +0.8 |
| De Villiers | 243 | 100.2 | 100.0 | +0.2 |
| Kleinplaats | 172 | 61.9 | 61.1 | +0.8 |
| Land-en-Zeezicht | 229 | 85.4 | 86.4 | -1.0 |
The rainfall, while consistent, was not evenly distributed across all catchments. This contributed to the mixed trends in dam level changes over the week.
If rainfall continues in the coming week at similar levels, dam levels are expected to maintain or slightly improve. The system appears to be stabilising with most major dams already near full capacity.